Get a Quote
| Name | Triiodothyronine (T3) antibody | |||||
| Catalog # | R515n5 | R514n5 | R513c8 | |||
| Type | Rabbit monoclonal antibody | |||||
| React Species | Human | |||||
| Platforms | Chemiluminescence Immunoassay (CLIA) | Immunochromatography assay (ICA) | ||||
| Matched Pair | R515n5 (Capture) - R514n5 (Detection) R515n5 (Capture) - R513c8 (Detection) |
R513c8 (Capture) - R515n5 (Detection) | ||||
| Purity | Purity>95%, purified by Protein A/G chromatography | |||||
| Buffer | 1 x PBS, pH 7.4 | |||||
| Storage | Aliquot and store at -20°C or lower. Avoid freeze / thaw cycles. | |||||
| Name | Catalog # | Conjugate | Matched Pair | Platform | Methodology |
| T3 Antibody | L344h1 | AE | L343h1 (Capture) - L344h1 (Detection) |
Chemiluminescence Immunoassay (CLIA) |
Sandwich |
| L343h1 | Biotin |
| Name | Catalog # | Platform | Methodology |
| fT3 Reagents | Q120k1 | Chemiluminescence Immunoassay | Sandwich |
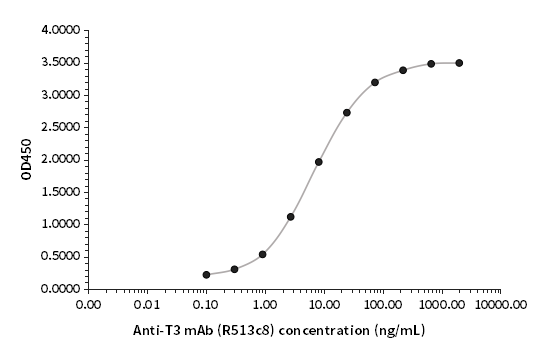
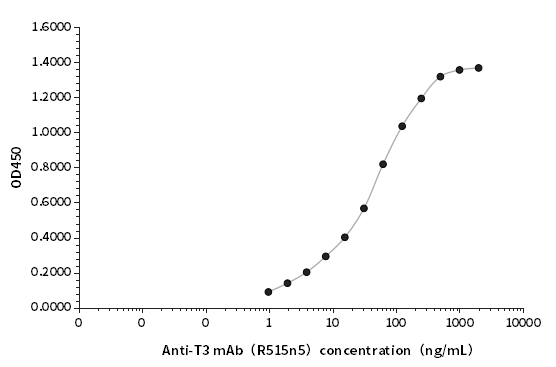
T3 antibodies R513c8, R514n5, and R515n5 were detected via ELISA platform using the T3 antigen with EC50s of 6.86, 7.71, and 50.8 ng/mL, respectively.

Roche-assigned fT3/tT3 clinical samples were detected using the R515n5 (Capture)-R514n5 (Detection) antibody pair. The T3 Sandwich antibodies (R515n5, R514n5) on the direct Chemiluminescent Immunoassay (CLIA) platform demonstrated a 10 times higher signal-to-noise ratio (S/N) compared to the Competitive Immunoassay. The fT3 detection sensitivity achieved is 0.1 pmol/L, and a strong correlation (R2 > 0.99) was confirmed between the detection results and Roche-assigned samples.
| Calibrator | Concentration(pmol/L) | RLU Avg. | Curve |
| S1 | 0 | 5407 | y=38133x+5407 |
| S2 | 3.3 | 131246 | |
| 20 times RLU Avg.(Blank) | 5549 | ||
| SD | 143.2 | ||
| Average Value +2SD | 5836 | ||
| Lowest Detection Limit (pmol/L) | 0.011 | ||
| Sample | Concentration (pmol/L) |
RLU |
| 1 | 0.000 | 5407 |
| 2 | 3.32 | 131246 |
| 3 | 7.15 | 265489 |
| 4 | 18.63 | 856983 |
| 5 | 30.12 | 1656988 |
| 6 | 49.55 | 2556942 |
Table 1. fT3 Clinical comparison analysis data on CLIA
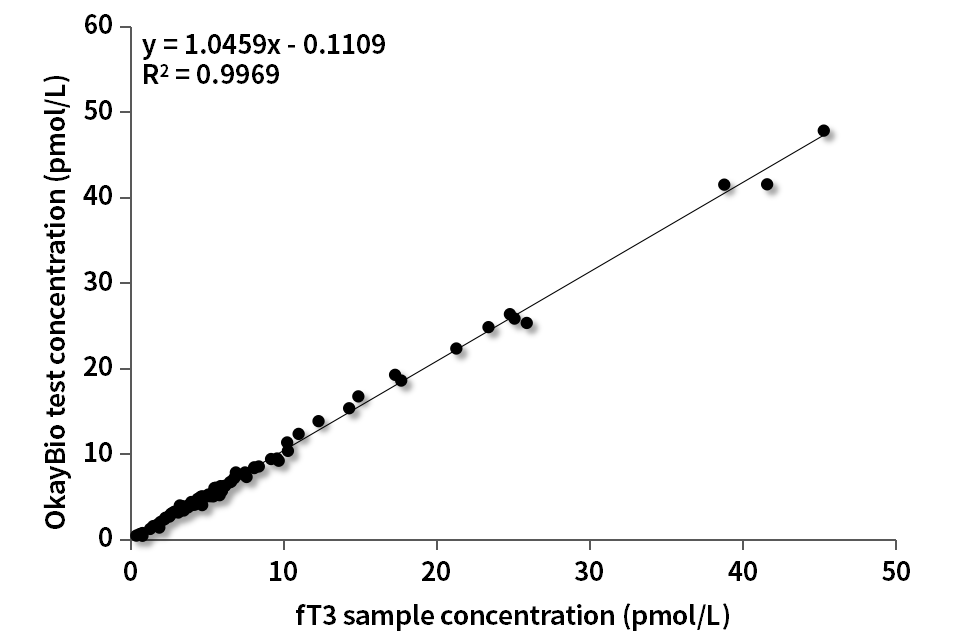
Figure 4. fT3 Standard curve on CLIA
| Sample | Concentration (pmol/L) |
RLU |
| 1 | 0.000 | 3407 |
| 2 | 0.40 | 90705 |
| 3 | 1.00 | 244456 |
| 4 | 2.48 | 1094240 |
| 5 | 4.94 | 3139387 |
| 6 | 10.12 | 7028859 |
Table 2. tT3 Clinical comparison analysis data on CLIA
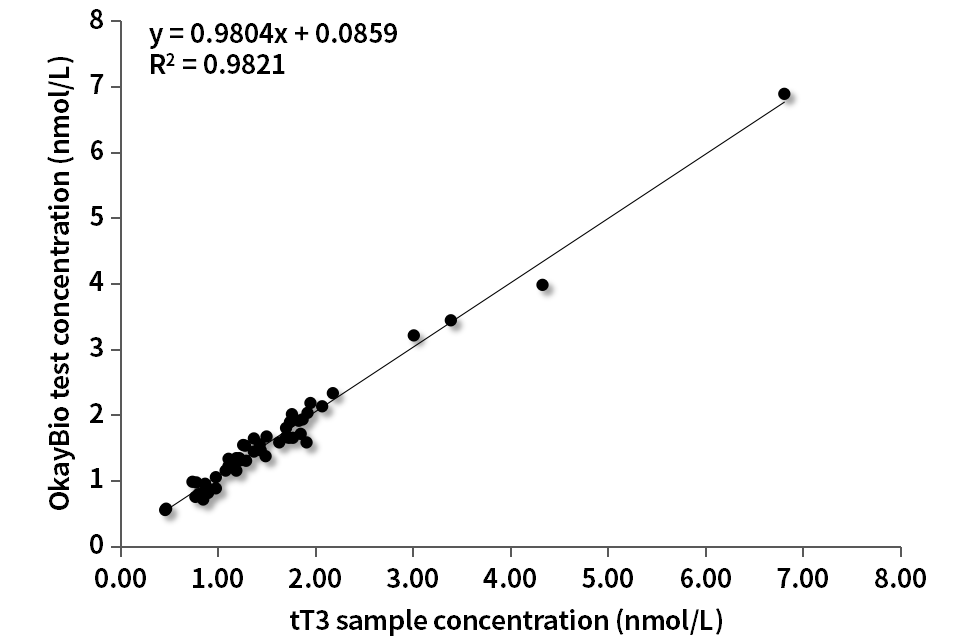
Figure 5. tT3 Standard curve on CLIA
L-T4 at 500ng/mL was measured via T4 sandwich antibodies (R515n5, R514n5), and the cross-reactivity was 0.01%.
Roche-assigned fT3/tT3 clinical samples were detected using the T3 Sandwich antibody pair R513c8 (Capture) - R515n5 (Detection) on the Time-resolved Fluorescent Immunoassay (TRFIA) platform. A strong correlation (R2 > 0.94) was confirmed between the detection results and Roche-assigned samples.
| Concentration (ng/mL) |
T value | C value | T/C |
| 0 | 205 | 20862 | 0.0098 |
| 0.08 | 5411 | 20484 | 0.2641 |
| 0.16 | 10342 | 21160 | 0.4888 |
| 0.8 | 40969 | 19130 | 2.1416 |
| 4 | 64041 | 19371 | 3.3061 |
| 20 | 84362 | 21193 | 3.9807 |
Table 3. T3 Clinical comparison analysis data on TRFIA
| Concentration (ng/mL) |
T value | C value | T/C |
| 5 | 345 | 22103 | 0.0156 |
| 20 | 1564 | 20159 | 0.0776 |
| 100 | 8298 | 18947 | 0.4380 |
| 500 | 31267 | 21537 | 1.4518 |
| 2000 | 50473 | 20476 | 2.4650 |
Table 4. T4 Cross reactivity data on TRFIA
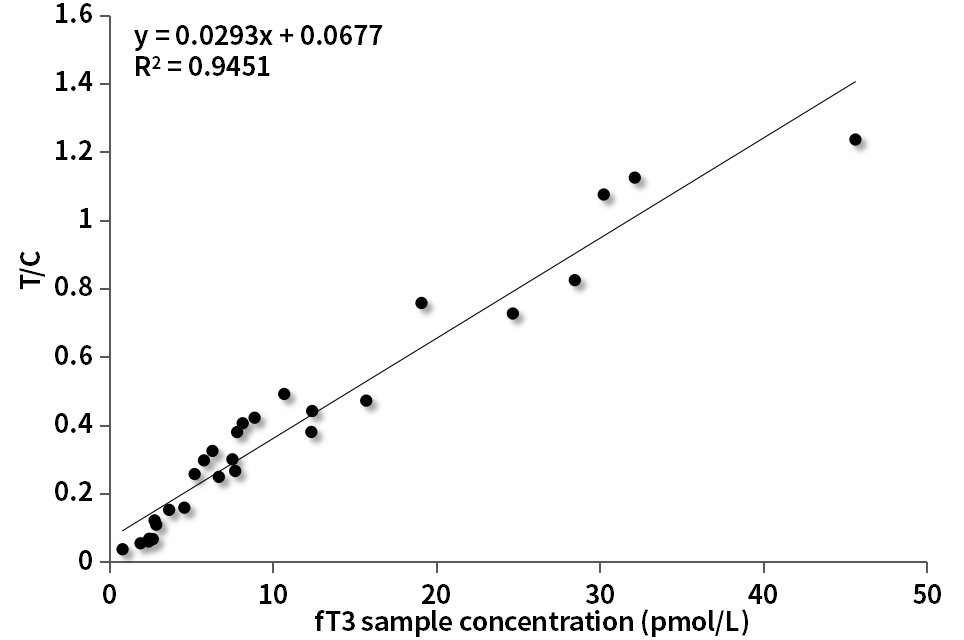
Figure 6. fT3 Standard curve on TRFIA
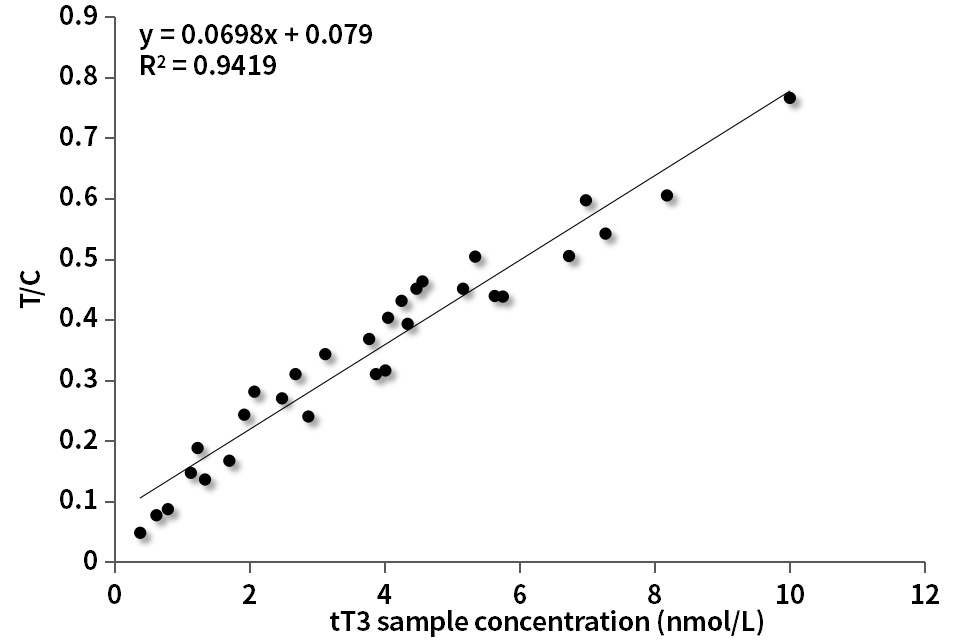
Figure 7. tT3 Standard curve on TRFIA
